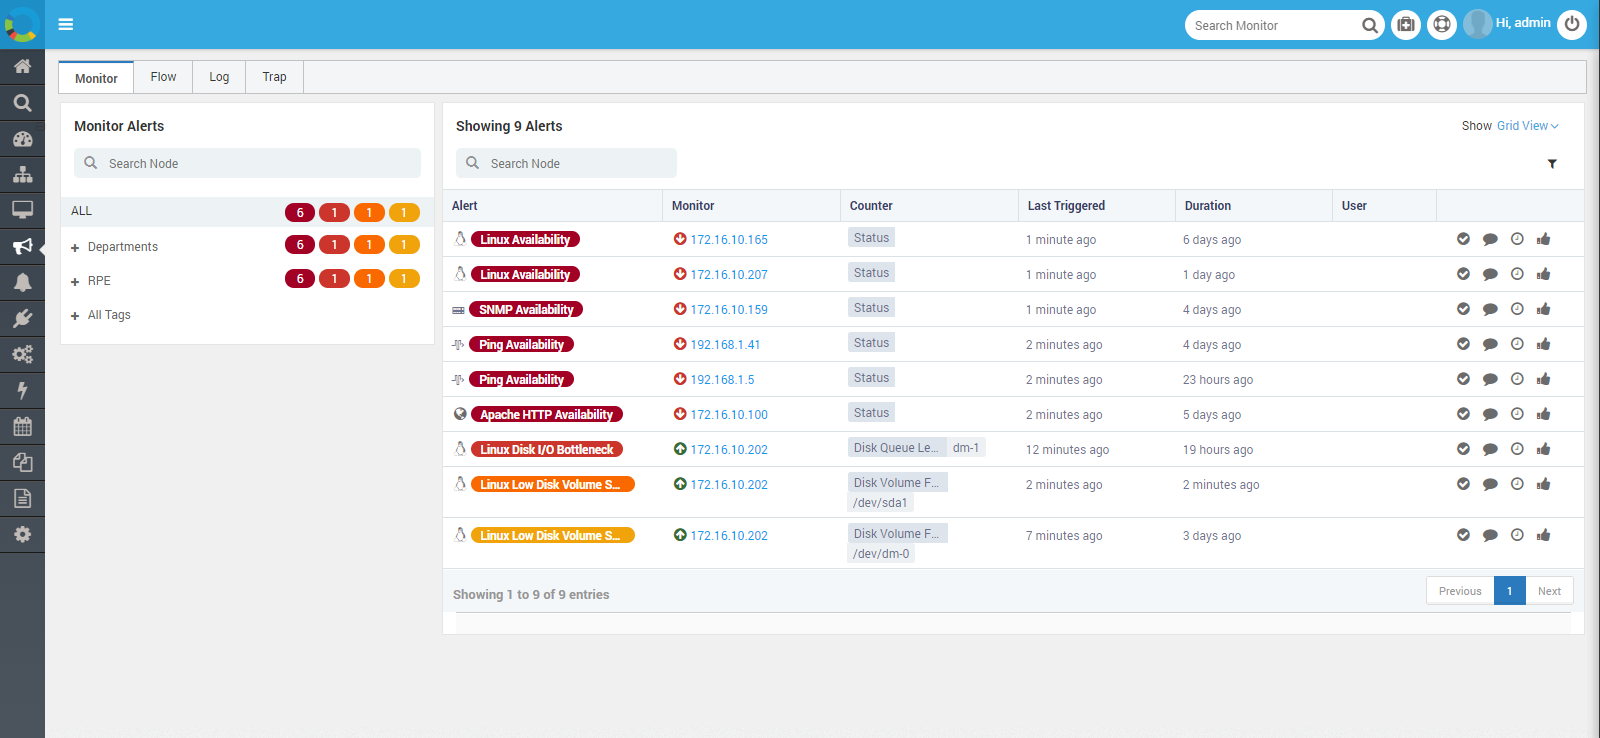
7. Alert Stream
Alert stream shows you the latest and most current alerts from the last poll. This is the first screen you should look when a network issue is raised. The section gives the information about:
The name of the alert triggered in last poll.
The name of the monitor that has entered into the alert state.
The severity status of the monitors captured in the last poll.
The availability of the monitor: up, down or unreachable.
Time duration of the last triggered.
Duration of monitor in the current alert state.
This screen is useful to see the most recent alerts in the system. System can reduce alert volume and false alarms with the help of Motadata AIML engine. This information will help you to understand the criticality of monitors so you can take necessary actions. You can also drill-down the clickable fields and see their historical data. Hence the information will help you to decide what kind of action you need to take. For example: some alerts might be of low importance or say generated due to some scheduled work. You can suppress those alerts for a specific period and Motadata will not show them till that time. Also, you can easily differentiate between the new alerts and the existing alerts that have already been read and acted upon
The alert stream page has four tabs: Monitor, Flow, Log and Trap. As name suggests, each tab shows the alerts of the respective type.
Alert Stream